


Disease area
Non-alcoholic fatty liver disease is the hepatic manifestation of metabolic disorder and is outlined by hepatic lipid accumulation that may progress to an aggressive form of fatty liver disease: the non-alcoholic steatohepatitis (NASH). NASH is characterized by liver inflammation, progressive scarring and fibrosis causing cirrhosis in most of the cases thus leading to liver failure (1). Currently, there is no approved pharmacological treatments for NASH (2), thus, screening the pre-annotated donated chemical probe (DCP) set with relevant phenotypic endpoints could shed light on the disease pathophysiology and would enable identification of druggable targets.
Rationale
One of the key limitations in drug development for NASH is the unattainability of an in vitro model that recapitulates faithfully the various stages of the disease and their major hallmarks. For this purpose, we find it crucial to develop a NASH model that truly depicts all aspects of the disease.
Aim
We want to develop a patient-derived NASH model that manifests the key characteristics of the disease namely steatosis, inflammation, and fibrosis. Afterwards, we will use this model as a platform to screen the DCP compounds and evaluate their impact on NASH progression by measuring intracellular lipid accumulation, inflammatory markers as well as fibrosis precursors.
Methods
Cell culture: We co-cultured patient-derived non-parenchymal cells (NPC, LifeNet) from a donor with early-stage fibrosis with healthy primary human hepatocytes (PHH, BioIVT) (1:6 PHH to NPC ratio) in a multi-well 96-well plate format (Elplasia, Corning). We seeded the cells at a density of 40,000 cells/well in William’s E medium supplemented with 11mM glucose, insulin (10ng/mL in Control or 10μg/mL in NASH), 5.5μg/mL transferrin, 6.7ng/mL selenite, 100nM dexamethasone, 2mM L-glutamine, 100U/mL penicillin, 100μg/mL streptomycin, and 10% fetal bovine serum (FBS).
Upon spheroid aggregation (5-7 days), we phased out FBS; to aggravate NASH phenotype we added a 0.6% (w/v) albuminconjugated free fatty acid (FFA) into the media, consisting of equimolar palmitic and oleic acid (240μM final concentration each). FFA was not supplemented in Control, mimicking lifestyle intervention by reducing nutrition and fat uptake. For the treatment groups, we treated the spheroids with FFA and the DCP compounds for 2 weeks with redosing every 2-3 days. We screened 91 probes at their 1x concentration (mostly 1μM, some 0.1μM).
Throughout the DCP screening we identified some DCP hits that reduced significantly at least one of the studied NASH endpoints. We validated the efficacy of these probes by using their non-active analogue at 1x concentration using the same experimental setup as the active compounds, we also tested their dose-dependent effect on the corresponding endpoints by using unchanged experimental setup but testing 0.2x, 1x and 10x of the hit probe.
Read-out:
Steatosis: After 2 weeks of treatments, we fixed the spheroids with 0.4% methanol-free formaldehyde and washed with PBS three times, then stained with DAPI (Ex/Em: 358/461) and NileRed (Ex/Em: 495/520 and 555/565). We developed an automated scoring using confocal imaging system (Opera Phenix, PerkinElmer) to assess relative triglyceride accumulation.
Results
Steatosis: Triglyceride accumulation was significantly higher in NASH compared to control group, demonstrating a successful establishment of a patient-derived NASH model that can be used to assess anti-steatosis efficacy of test compounds. Results for some DCP compounds are shown in figure 1.
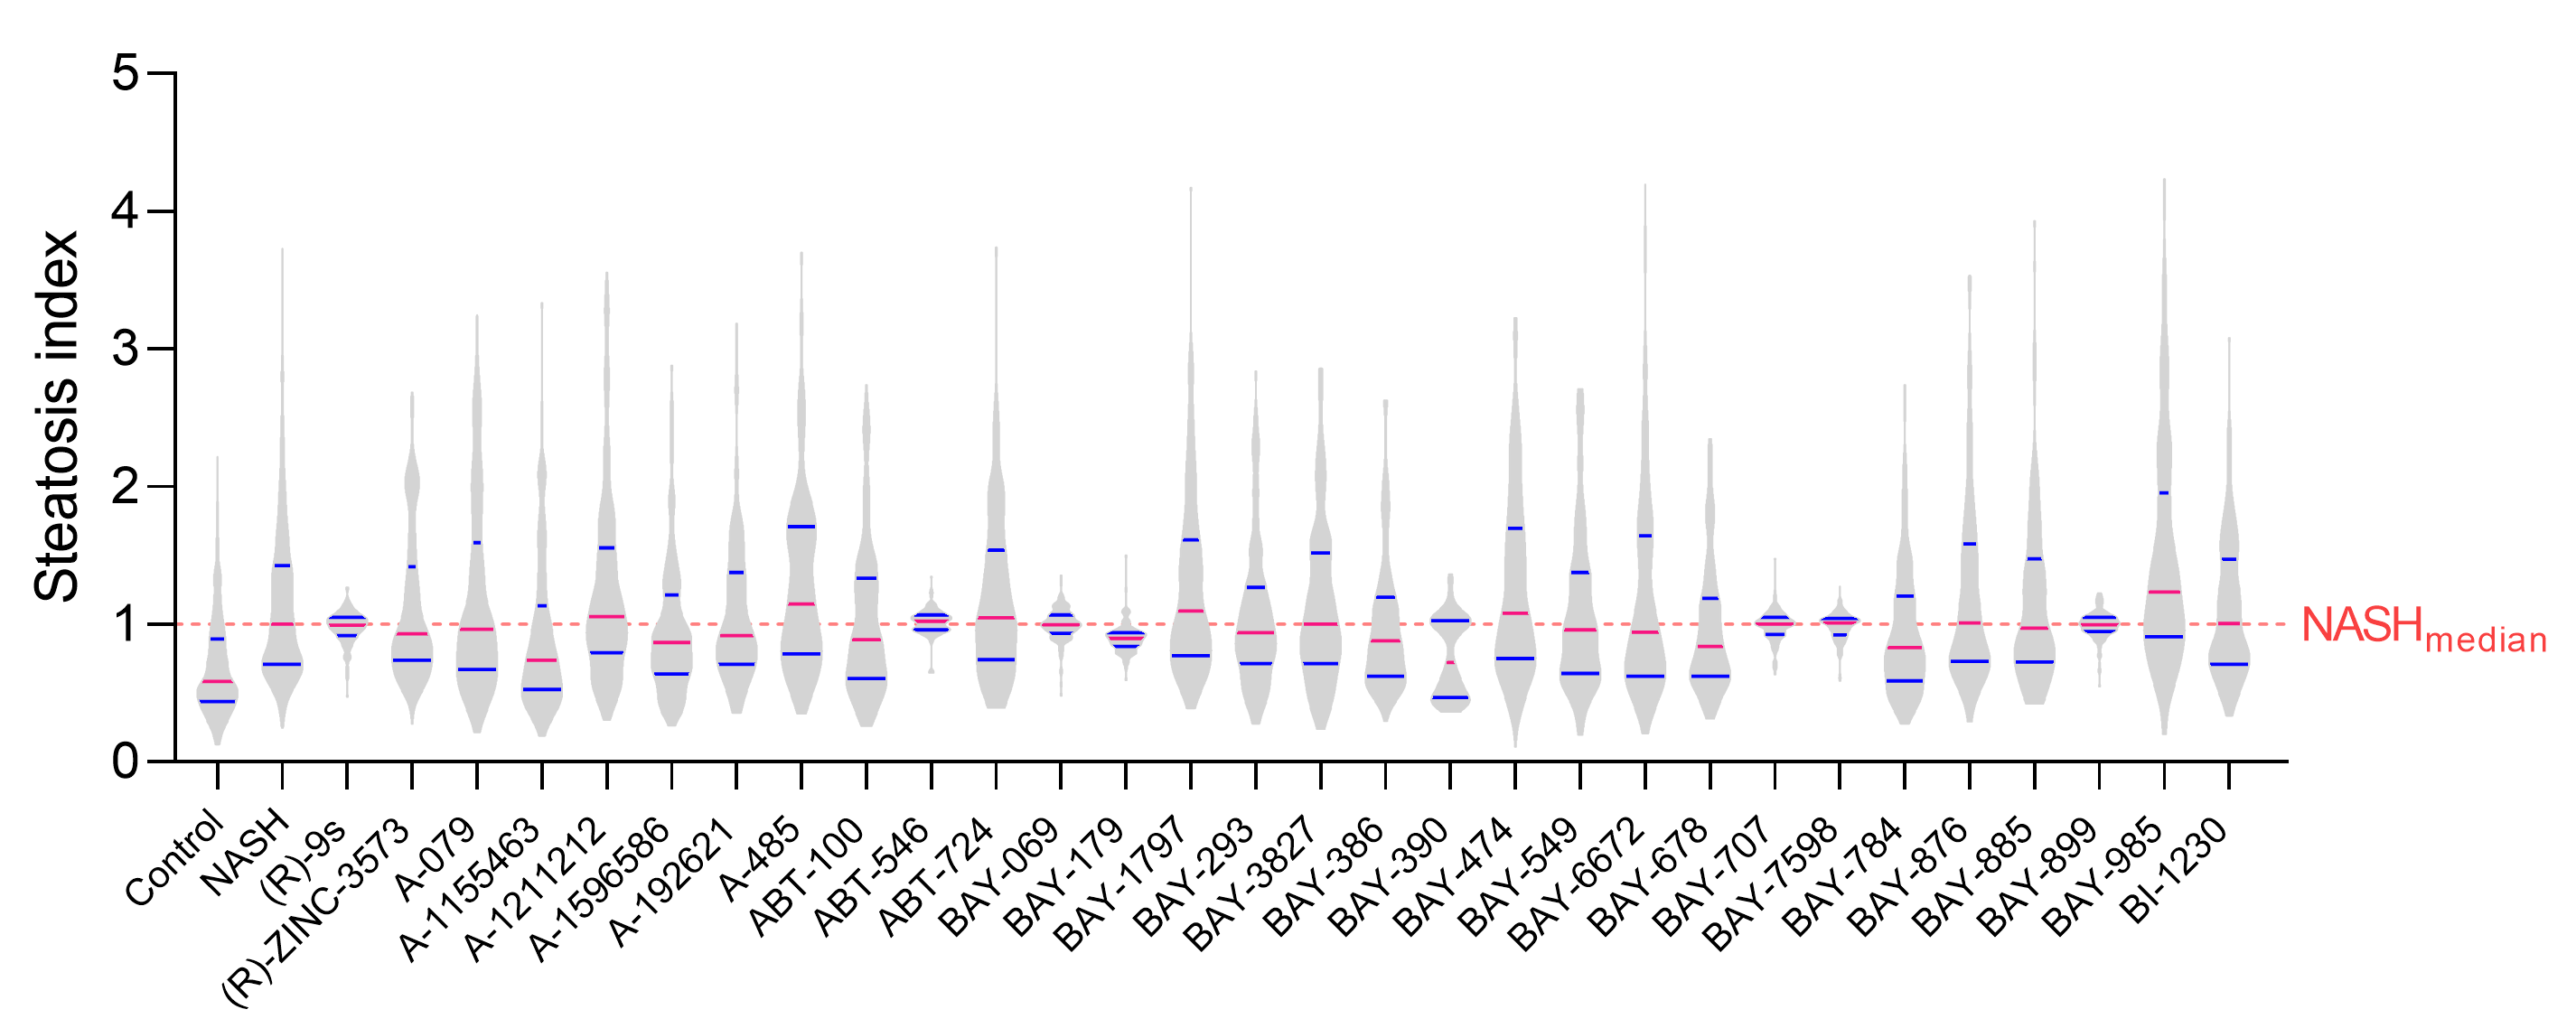
Figure 1. Lipid quantification in NASH spheroid treated with DCP compounds. Values are calculated steatosis index per spheroid based on automated high-content imaging workflow using Opera Phenix (Perkin Elmer). Steatosis index is defined as a ratio between signal from triglyceride staining normalized to nucleus or phospholipid signal. To account for batch-to-batch effect, each value is normalized to median signal of the NASH group in the same imaging batch. Each violin plot represents lipid quantification from at least 100 spheroids. In each violin plot, blue line represents quartiles, red line represents median. Note that only results from some of the DCP compounds are shown here.
Conclusions
We developed a patient-derived assay for NASH that can faithfully reproduce the hallmarks of the disease. We used this assay to screen for potential drug targets using the DCP compound set. As a result of this screening, we have identified probes that efficaciously reduced steatosisrevealing potential drug targets for NASH. Additionally, we validated the specificity of the hit probes by using non-active analogues and by showing a dose-dependent effect (data not shown).
References
- Schwabe R et al.; Mechanisms of Fibrosis Development in NASH (2020).
- Kemas et al.; Non-alcoholic fatty liver disease - opportunities for personalized treatment and drug development (2021).