


Disease area
Colorectal cancer (CRC) remains one of the most lethal malignancies and is often diagnosed at a progressed stage when tumor cell dissemination has already started. The tumor microenvironment (TME) plays a crucial role in regulating malignant tumor characteristics including growth, metastasis, and therapy resistance. Cancer-associated fibroblasts (CAFs) are one of the main cell types in the TME that show considerable heterogeneity and plasticity. Through different processes, such as paracrine signalling or metabolic changes, CAFs can modulate the cancer phenotype.
Rationale
Patient-derived tumor organoids (PDTOs) can serve as preclinical model that mimics the molecular and phenotypic characteristics of the individual tumor. We have established and characterized a CRC organoid-stroma biobank comprising matched PDTOs and CAFs. To model the response to chemotherapy, we have exposed PDTOs, to SN-38 and Gefitinib in presence or absence of CAFs and measured individual therapy responses. Pharmacotyping in n=29 biobank models showed a wide range of drug sensitivities and allowed to identify stroma-induced resistance phenotypes providing an opportunity to study the underlying mechanisms.
Aim
To identify stroma-mediated resistance mechanisms to Gefitinib and SN-38, organoid-CAF co-cultures were subjected to a library of chemical probes alone or in combination with a sub-toxic dose of therapy to re-sensitize these co-cultures.
Methods
Cell culture: PDTOs were established and cultured as previously described (van de Wetering et al., 2015). Tumor cells are cultured in full medium containing advanced DMEM/F12 supplemented with 10 mM Hepes, 1× Glutamax, 1× penicillin/streptomycin, 2% B27, 12.5 mM N-acetylcysteine, 500 nM A83-01, 10 μM SB202190, 20% R-spondin 1 conditioned medium, 10% Noggin conditioned medium, 50 ng/ml human EGF. Fibroblasts were cultured in medium containing DMEM, 10% FCS and 1% penicillin/streptomycin.
General protocol: To measure drug effects in co-culture, organoids were transduced with Luciferase2-P2A-EGFP lentivirus as described (Schnalzger et al., 2019). Single organoid cells were seeded alone or in presence of CAFs in 96-well plates in 15 µl 90% Matrigel and grown for 3 days in full organoid medium (100 µl/well). On day 3, cells were washed and cultured with growth factorreduced medium in presence of therapeutic drug for 6 days. Sensitivity to SN-38 or Gefitinib was tested at 7-point dilution using a digital dispenser (Tecan D300e).
For combinatorial studies we screened co-cultures of O14 and O23, which showed strongly increased resistance to Gefitinib (both) and SN-38 (O23). Cells were enzymatically dissociated and seeded as above. To identify drugs that re-sensitize co-culture to therapy we performed the library screen at a single concentration alone or in the presence of a sub-toxic concentration of Gefitinib or SN-38 for 6 days. The pharmacological library contained 186 active and 106 negative control compounds.
Readout: One-Glo EX Luciferase system was used as readout on day 9.
Results
All biobank lines (n=29) were tested in the absence and presence of CAFs. Singularized cells were let to recover for 3 days before exposure to therapy for 6 days (Fig. 1A). Drug treatment in mono-and-co-culture revealed a heterogenous spectrum of drug sensitivities, as determined by the area under the curve (AUC). While dose responses to SN-38 was nonuniformly affected by the presence of CAFs, CAFs induced a generalized resistance to Gefitinib in organoids (Fig. 1B/C). The combination screen was performed in two resistant co-culture lines and luciferase activity was measured after 6 days (Fig. 2A). Inhibition of MET was identified as the top sensitizer for Gefitinib together with other inhibitors targeting the RTK/RAS pathway, both in O14 and O23. In contrast to O23, O14 also showed a pronounced therapy induced vulnerability to bromodomain (BRD)-containing proteins (Fig. 2B-C). To overcome SN-38 resistance in O23 different targets were identified including apoptosis regulators (BCL2, RIPK1) or the respiratory chain complex 1 (Fig. 2D).
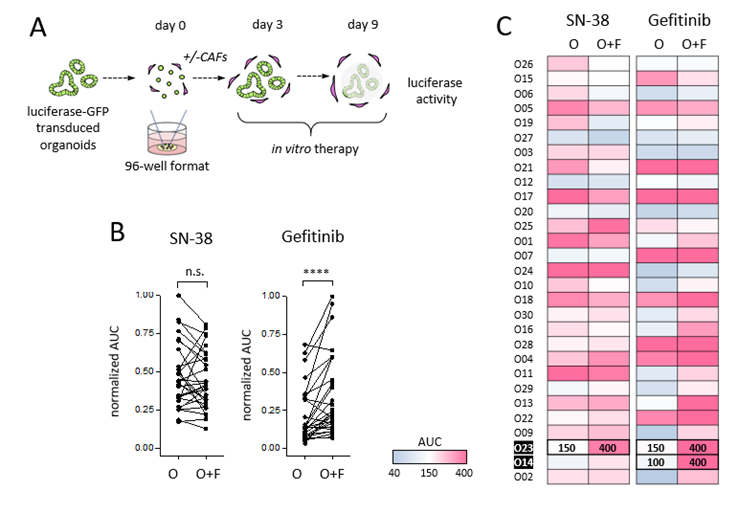
Figure 1. Pharmacotyping of organoid-stroma biobank. A) Schematic design of the assay to score the stromal influence on drug responses. B) Sensitivity to SN-38 and Gefitinib treatment in mono- and co-cultures (n=29). Tumor cell viability was assessed by luciferase measurement in transgenic organoids. Normalized AUC was calculated by dividing the maximum AUC value for each drug. ****: p<0.0001. C) Heatmap of SN-38 and Gefitinib drug sensitivity in presence or absence of CAFs (AUC monoculture & coculture). The stroma-induced drug resistance lines O14 and O23 were used for the combinatorial screens (marked in bold).
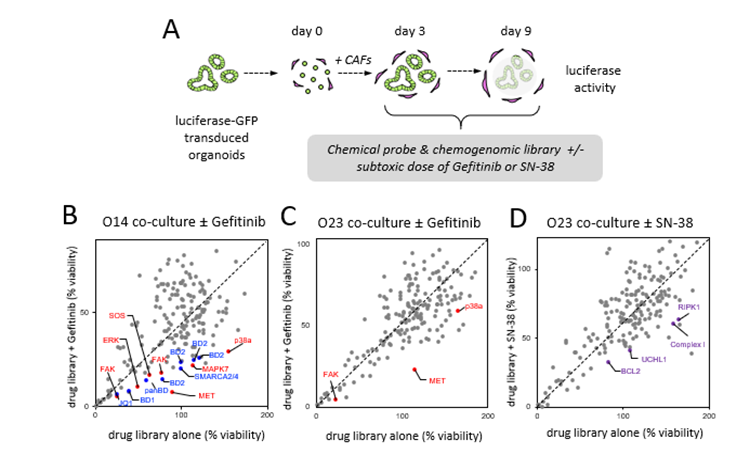
Figure 2. Pharmacologic screens reveal patient- and treatment-specific resistance mechanisms. A) The chemogenomic library containing 186 compound was tested in O14 and O23 in co-culture with F14. Stroma-induced resistance was analysed by comparison of library alone or in combination with a sub-lethal concentration of Gefitinib (B/C) or SN-38 (D). Tumor cell viability was assessed by luciferase measurement in transgenic organoids. Mean data from 2 experimental replicates is shown. Top hits comprise MET and other RTK/RAS pathway associated proteins (red), bromodomain protein inhibitors (blue) and apoptosis regulators (violet).
Conclusions
Together, our results show that CAFs confer resistance via common mechanisms but also in a patient- and therapy-dependent manner. We present a powerful patient cell assay that allows to screen chemogenomic compound libraries to overcome therapy resistance. The data is part of a collaborative EUbOPEN manuscript which has been recently published (Farin et al., 2023).
References
- van de Wetering et al., 2015, Cell 161, 933–945.
- Schnalzger et al., 2019, EMBO 238(12): e100928
- Farin H.F., et. al., 2023, Cancer Discov 13(10):2192-2211