


Disease area
Colorectal cancer (CRC) is a leading cause of cancer-related mortality worldwide, often diagnosed in advanced stages when tumor cells have already begun to spread. Despite progress in chemotherapy and targeted therapies, which provide modest enhancements in overall survival rates, therapy resistance poses a significant challenge in clinical practice. Addressing this resistance demands innovative strategies for pinpointing actionable targets within the cancer cells.
Rationale
To overcome CRC therapy resistance and identify druggable targets, patient-derived tumor organoids (PDTOs) can serve as preclinical models that mimic the molecular and phenotypic characteristics of the individual tumor. We have generated a CRC organoid biobank and performed drug screening using viability end-point readouts (Farin et. al., 2023). Image-based screening could allow more continuous monitoring of organoids including detection of non-lethal phenotypes, which could greatly improve the capacity to characterize drug responses in vitro.
Aim
Establish and validate an image-based readout for chemogenomic profiling to uncover novel insights into patient-specific tumor vulnerabilities.
Methods
Cell culture: Organoids are established and cultured as described in detail in the protocols deposited in the EUbOPEN website (Protocol for generation of normal and tumor organoids from human colorectal tissues).
General protocol: Organoids were transduced with Luciferase2-P2A-EGFP lentivirus as described (Schnalzger et al., 2019). O06, O09 and O21 (Farin et al., 2023) were seeded as single organoid cells in 96-well plates in 15 µl 70% Matrigel and grown for 3 days in full organoid medium (100 µl/well). On day 3, cells were washed and cultured with growth factor-reduced medium in presence of the drug library for 6 days. The DCP library incl. chemogenomic kinase set (370 compounds with negative control compounds) was used. The screen was conducted in 2 independent replicates.
Readout: Organoids were studied 9 days after seeding. Brightfield images were recorded in a Cytation C10 microscope using a 2.5x objective after 6 days of treatment. The primary mask and size selection of the objects was applied individually to each organoid line (object size adjusted between 50-1000 µm). Image analysis was performed on the sum area metric, and the data were normalized to the DMSO control. After imaging the organoid viability was measured using the OneGloEX Luciferase Assay System (E8110, Promega).
Results
After drug library screening, measurement of the total organoid object area was performed automatically from images captured from entire 96 well plates followed by the endpoint luciferase measurement (Fig. 1A). Pearson correlation analysis between replicates showed high robustness of the luminescence data (Fig. 1B; of 0.85) and the total organoid area (Fig. 1C, 0.81). Principal Component Analysis (PCA) was conducted using the screening data from three patients to distinguish individual response patterns. While replicates again showed high similarity, profound inter-patient differences were observed in the luminescence (Fig. 2A) and image-based data (Fig. 2B). Pearson correlation and hierarchical clustering of all data showed that both read-outs are capable to identify similar patient-specific drug responses (Fig. 2C).
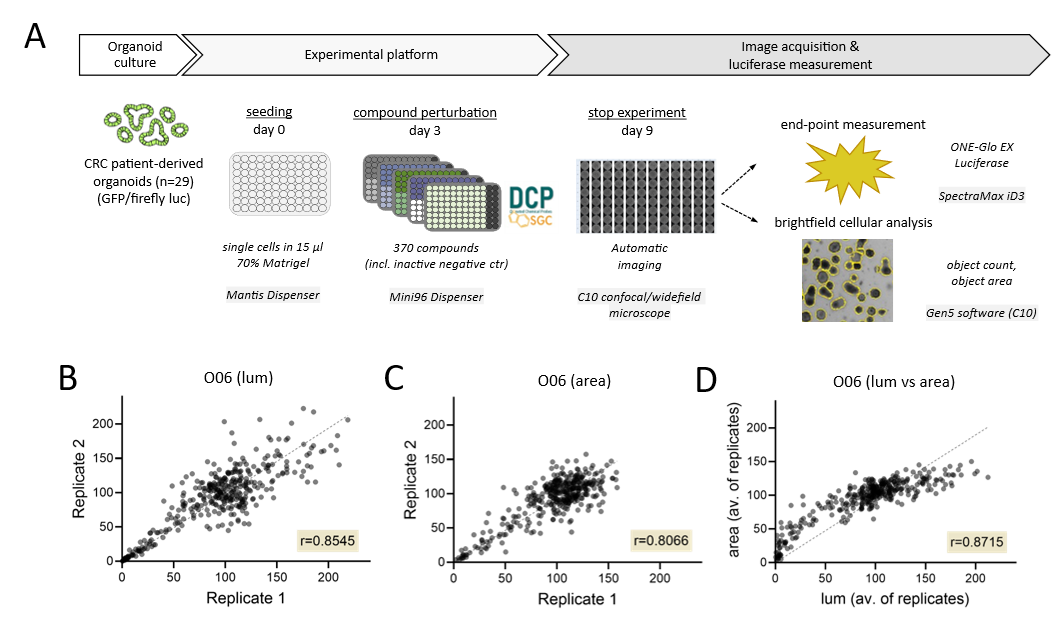
Figure 1. Semi-automatic platform for profiling organoid viability by enzymatic and image-based read-outs. A) Illustration of the drug screening assay (DCP library) and analysis pipeline. B/C) Correlation plot of organoid viability between two replicates analysed by OneGloEX luciferase measurement (lum, B) or microscopic analysis (total area, C). D) Correlation plot comparing average organoid viability scored by luminescence and area analysis. The entire library of 370 compounds was plotted in the correlation analysis. Dotted lines, linear regression.
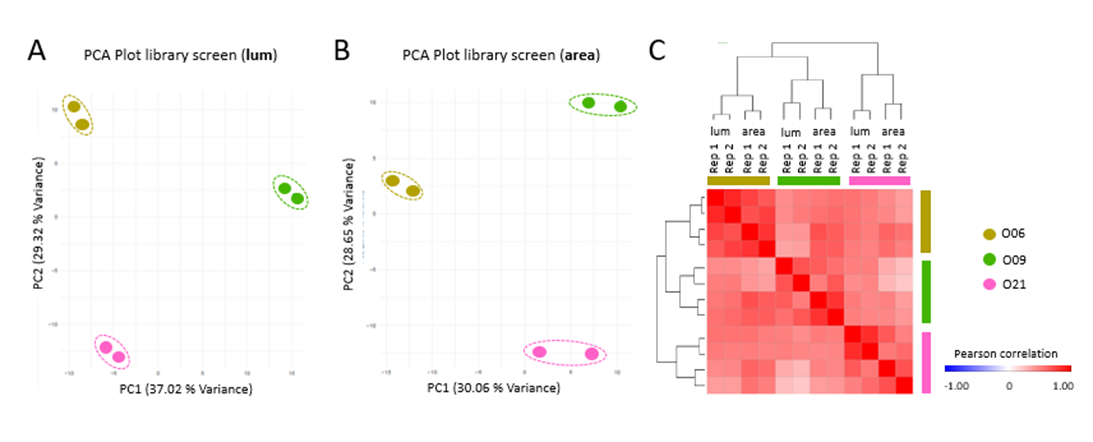
Figure 2. Image-based and enzymatic read-outs capture patient-specific responses of CRC organoids. Principal Component Analysis (PCA) plots of patient-specific drug library responses assessed by luminescence measurement (lum, A) or image-based analysis (area, B). Two technical replicates each. C) Combined similarity matrix (Pearson correlation) after hierarchical clustering shows that both read-outs allow assessment of similar patient-specific drug responses.
Conclusions
Taking together, we have established a robust semi-automatic screening platform that allows to score organoid viability by endpoint and image-based assays, improving the capacities for longitudinal monitoring of drug responses.
References
- Farin et. al., 2023 Cancer Discov. 2023 Oct 5, 10.1158/2159-8290.CD-23-0050
- Schnalzger et al., 2019, EMBO 238(12): e100928